DTrace and the little ustack helper that could
Flamegraphs are awesome if you need to profile your node.js application. They provide a nice looking visual view of where your application is spending its time. Although they're well documented, no one has ever said a word on how they work internally, but everyone mentions "ustack helper" which, right now, works only on SmartOS.
Call stack #
To understand profiling, one must understand what a callstack is. During its
lifetime every application is using stack, which is a chunk of memory which can
be changed by using push, pop, call and other CPU instructions, or
by accessing it directly.
The push and pop instructions simply expand/shrink stack storing/loading
data on top of it. The call instruction is a little bit more interesting:
(Quote from Intel® 64 and IA-32 Architectures Software Developer’s Manual)
...the processor pushes the value of the EIP register (which contains the offset of the instruction following the CALL instruction) on the stack (for use later as a return-instruction pointer). The processor then branches to the address in the current code segment specified by the target operand.
So coupled with the ret instruction call allows you to jump into some
function and return back to the place where it was called. (Despite it's
simplicity, I still find it amazing.)
That's how calling functions really work internally, but stack can be also used to store local (on-stack) function's data. This is achieved using stack frames. This is how functions' assembly code do usually look:
(I'll use AT&T assembly syntax)
push ebp ; Save previous frame pointer
mov  esp, ebp ; Set new frame pointer
sub  $0x60, esp ; Allocate space on stack

; Function's body.
mov  $0x10, -0x8(%ebp) ; set on-stack variable

mov  ebp, esp ; Shrink stack to it's initial value
pop  ebp ; Restore previous frame pointer
ret  0 ; Return to caller
If represented graphically stack generally looks like this:

The main pros of using structure above are:
- Easiness of restoring stack back to its initial position
- Fast and simple access to on-stack variables
Stack trace #
Suppose your application has thrown an exception or crashed with a segmentation fault. To find the cause of the problem one may start by looking at the stack trace where the crash has happened:
#0  0x00007fff84356d16 in kevent ()
#1  0x00000001000557b7 in kqueue_poll ()
#2  0x000000010004c77a in uv__run ()
#3  0x000000010004c92a in uv_run ()
#4  0x0000000100015319 in node::Start ()
#5  0x000000010000dd24 in start ()
Here, on the left, you can see addresses of functions' code. Debugger gets them
by taking current eip and ebp registers (which stands for current
instruction address and current stack frame address), walking stack frames and
collecting return addresses from it. On the right side, you can see functions'
real names. gdb automatically loads this information for you by searching
for debugging symbols corresponding to addresses it has collected.
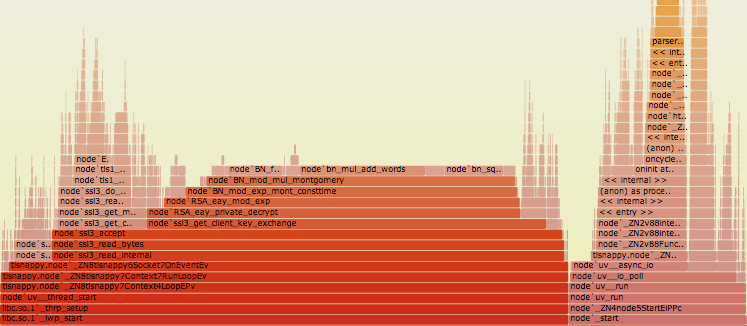
Flamegraph #
In order to create flamegraph, one will need to periodically collect application's stack traces and join them (the process is called statistical profiling), making boxes with functions that were called more often - wider, and putting box on the top of another box only if their functions appear above each other in the stack trace.
V8's stack frames #
When collecting stack traces of C/C++ application, dtrace will use static debugging information using binary's symbols table. But when it comes to dynamic languages, getting such information turns out to be more complicated: functions are compiled lazily, often recompiled with applied optimizations, old code may be evicted by GC... in other words, application is evolving during its execution.
Thankfully, V8 provides this information, but instead of debugging symbols it stores it in stack frames. Here is an example of v8's stack frame structure:

So knowing this structure we can identify frames by checking marker/function value and getting function names from V8's heap (it's too big topic to cover here, believe me).
That's exactly the job of ustack helper, it takes frame address and should figure
out and return function's name, or just fail. So everytime you call jstack()
function in DTrace probe, ustack helper will be called for every unidentified
frame.
ustack helper example #
NOTE: some knowledge of D language is required to fully understand code below
dtrace:helper:ustack:
{
  /* frame pointer */
  this->fp = arg1;

  /* Last statement - result */
  "whoa! you've identified me";
}
If you replace contents of src/v8ustack.d in node.js sources, recompile it
(on SmartOS), run bash benchmark/http-flamegraph.sh, and open stacks.src,
which should contain following stack traces:
node`_ZN2v88internal7Context14native_contextEv
node`_ZN4node10StreamWrap15WriteStringImplILNS_13...
node`_ZN4node10StreamWrap15WriteUtf8StringERKN2v89ArgumentsE+0x9
whoa! you've identified me
whoa! you've identified me
whoa! you've identified me
As you can see, DTrace has identified some C++ functions and for all other addresses has called our ustack helper.
Let's read some data from V8's stack frame:
#define FP_MARKER (-2 * 8)
#define FT_ENTRY (1 << 32)

/* Init */
dtrace:helper:ustack:
{
  this->fp = arg1;
  this->done = 0;
  this->marker = (uint64_t) 0;
}

/* Get marker */
dtrace:helper:ustack:
{
  this->marker = *(uint64_t*) copyin(this->fp + FP_MARKER,
                                     sizeof(uint64_t));
}

/* Match entry marker */
dtrace:helper:ustack:
/this->marker == FT_ENTRY/
{
  this->done = 1;
  "entry";
}

/* Match everything else */
dtrace:helper:ustack:
/!this->done/
{
  "everything else";
}
Run it again, and if you're lucky enough you'll find this in stacks.src:
everything else
everything else
entry
node`_ZN2v88internalL6InvokeEbNS0...
Important things about ustack helper:
- It's running within kernel (though, in it's own context, so it can't crash
it). The most important consequences of it is that user-land addresses can't
be accessed directly, but only by using
copyin()function. - Usage of control flow statements (if/foreach/while) in DTrace scripts is prohibited, since all probes should terminate in a reasonable time. Otherwise infinite loop in kernel space will cause your system to halt.
Debugging ustack helper #
During development of 64bit platform support for node.js ustack helper, I found that it's pretty hard to debug ustack helper. The only method to do this is insertion of probes which are returning some debugging information, and observing this information later in stack traces.
Additionally, it's worth noting that failed copyin() or any bad memory access
won't produce any informative output, but you'll see raw address in stack trace
(i.e. 0x0000000012345678) rather than your pretty real function's name.
Epilogue #
You can look at/play with node's ustack helper, big kudos to Dave Pacheco for developing it!
And you should check out Bryan Cantrill's and Dave Pacheco's presentation that explains many things that wasn't covered in this post: Dynamic Languages in Production: Progress and Open Challenges and video.
Huge thanks to Voxer for funding my investigation and work on porting DTrace ustack helper to 64bit platform! Guys, I love you. You're awesome!
- Previous: Candor returns
- Next: How to start JIT-ting